
A number, with context
Rice Purity Test Score Meaning
This Rice Purity Test score meaning guide explains how your total relates to selected items on the 100-question checklist, what high and low scores mean, and where interpretation stops.
What Does My Rice Purity Score Mean?
A Rice Purity Test score is 100 minus the number of selected items. A score of 35 means 65 selections on this 100-item checklist. It does not grade your character or explain the circumstances behind your answers.
Each checked item deducts one point. A higher total therefore means fewer selections; a lower total means more. Anything left unchecked—including a question you skip or cannot confidently interpret—deducts nothing. An unchecked answer does not necessarily mean an experience never happened.
Use this guide to interpret a total you already have. To calculate a new result from your answers, take or retake the Rice Purity Test. The checklist contains adult topics and is intended for adults 18 and older.
What Is a Good Rice Purity Test Score?
There is no universal “good” Rice Purity Test score. On this 100-question edition, a higher score means fewer items selected and a lower score means more. Neither direction grades your character or personal worth. Read the number as a checklist total; a claim that it is good, normal, or above average needs a clear definition and supporting comparison data.
Is 70, 80, or 90 a Good Score?
30 selected items
20 selected items
10 selected items
Each number describes a different count, not a better person. Two people with the same score can select different questions. Skipped or uncertain items also remain unchecked.
Why “Good Score” Ranges Differ Between Websites
Websites may choose different boundaries and names for their score bands. Those labels are publisher interpretations unless an authoritative standard is documented. A range called “good” on one site is not automatically a benchmark for this edition.
Read about high and low score ranges, assess average-score evidence, and understand the difference between percentage and percentile before comparing results.
Look Up Your Score: 0–100
Find the exact selected-item count for any score. The lookup and table use the same equation: selected items = 100 − score. Neither compares you with other people.
Enter Your Score
Your Score
Selected Items
Scale only — not a percentile or a measure of personal worth.
Calculated only in this page’s memory. No score is saved, sent, or added to the URL. Skipped items deduct no points.
Complete 0–100 Rice Purity Test Score Chart
Every possible integer is included below. Find your row to see the number of selected items, including when JavaScript is unavailable.
Prints the complete reference, not your entered score. Without JavaScript, use your browser’s Print command.
My Rice Purity Test
Rice Purity Test Score Chart
Score = 100 − selected questions. Selected items = 100 − score.
Higher scores mean fewer selections; lower scores mean more. Skipped or unchecked items deduct nothing.
Edition: rpt-classic-100, owner-supplied-2026-10-12-5133ffee2a3b. Reviewed October 12, 2026. Item 69 is supplied as “?”; its wording remains unresolved. This is an independent reference, not an official classification or a moral/personality assessment.
Source website: https://myricepuritytest.com/rice-purity-test-score-meaning/
View all 101 scores
| Rice Purity Score | Selected Items |
|---|---|
| Score 0 | 100 |
| Score 1 | 99 |
| Score 2 | 98 |
| Score 3 | 97 |
| Score 4 | 96 |
| Score 5 | 95 |
| Score 6 | 94 |
| Score 7 | 93 |
| Score 8 | 92 |
| Score 9 | 91 |
| Score 10 | 90 |
| Score 11 | 89 |
| Score 12 | 88 |
| Score 13 | 87 |
| Score 14 | 86 |
| Score 15 | 85 |
| Score 16 | 84 |
| Score 17 | 83 |
| Score 18 | 82 |
| Score 19 | 81 |
| Score 20 | 80 |
| Score 21 | 79 |
| Score 22 | 78 |
| Score 23 | 77 |
| Score 24 | 76 |
| Score 25 | 75 |
| Score 26 | 74 |
| Score 27 | 73 |
| Score 28 | 72 |
| Score 29 | 71 |
| Score 30 | 70 |
| Score 31 | 69 |
| Score 32 | 68 |
| Score 33 | 67 |
| Score 34 | 66 |
| Score 35 | 65 |
| Score 36 | 64 |
| Score 37 | 63 |
| Score 38 | 62 |
| Score 39 | 61 |
| Score 40 | 60 |
| Score 41 | 59 |
| Score 42 | 58 |
| Score 43 | 57 |
| Score 44 | 56 |
| Score 45 | 55 |
| Score 46 | 54 |
| Score 47 | 53 |
| Score 48 | 52 |
| Score 49 | 51 |
| Score 50 | 50 |
| Score 51 | 49 |
| Score 52 | 48 |
| Score 53 | 47 |
| Score 54 | 46 |
| Score 55 | 45 |
| Score 56 | 44 |
| Score 57 | 43 |
| Score 58 | 42 |
| Score 59 | 41 |
| Score 60 | 40 |
| Score 61 | 39 |
| Score 62 | 38 |
| Score 63 | 37 |
| Score 64 | 36 |
| Score 65 | 35 |
| Score 66 | 34 |
| Score 67 | 33 |
| Score 68 | 32 |
| Score 69 | 31 |
| Score 70 | 30 |
| Score 71 | 29 |
| Score 72 | 28 |
| Score 73 | 27 |
| Score 74 | 26 |
| Score 75 | 25 |
| Score 76 | 24 |
| Score 77 | 23 |
| Score 78 | 22 |
| Score 79 | 21 |
| Score 80 | 20 |
| Score 81 | 19 |
| Score 82 | 18 |
| Score 83 | 17 |
| Score 84 | 16 |
| Score 85 | 15 |
| Score 86 | 14 |
| Score 87 | 13 |
| Score 88 | 12 |
| Score 89 | 11 |
| Score 90 | 10 |
| Score 91 | 9 |
| Score 92 | 8 |
| Score 93 | 7 |
| Score 94 | 6 |
| Score 95 | 5 |
| Score 96 | 4 |
| Score 97 | 3 |
| Score 98 | 2 |
| Score 99 | 1 |
| Score 100 | 0 |
How the Score Is Calculated
Start with 100 points and deduct one for every selected question. All 100 items have the same weight.
Score = 100 − Number of Selected Questions
Convert a Score Into Selected Items
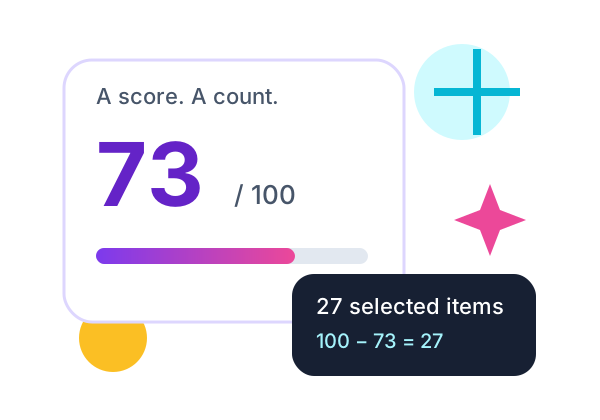
Subtract the score from 100 to work backward. If your score is 73, the calculation is 100 − 73 = 27 selected items. Score and selected count always add to 100 on this edition.

Percentage is not percentile. On a 100-question checklist, score 73 corresponds to 73% unchecked items and 27% selected items. Unchecked includes skipped questions. It does not mean “73% innocent,” and it does not say what percentage of other people scored above or below you. A population percentile would require a documented comparison dataset.
Worked Examples
These examples describe checklist selections, not typical scores or population averages.
77 selected items
100 − 23 = 77
65 selected items
100 − 35 = 65
50 selected items
100 − 50 = 50
23 selected items
100 − 77 = 23
8 selected items
100 − 92 = 8
0 selected items
100 − 100 = 0
100 selected items
100 − 0 = 100
Leaving a question unchecked costs no points. Selecting it changes the result by exactly one point, regardless of its topic.
High Scores, Low Scores, and Score Ranges
High and low describe position on the numerical scale. They do not make one result better than another.

What Does a High Score Mean?
A higher score means fewer items were selected. For example, 92 means eight selections. It does not prove innocence or tell you why other items were left unchecked.

What Does a Low Score Mean?
A lower score means more items were selected. A score of 23 means 77 selections. The total cannot establish a person’s character, risk level, or specific behavior.

What Does a Score of 50 Mean?
Exactly 50 of the 100 items were selected. That is the numerical midpoint—not evidence that the result is typical or average among people who take the test.

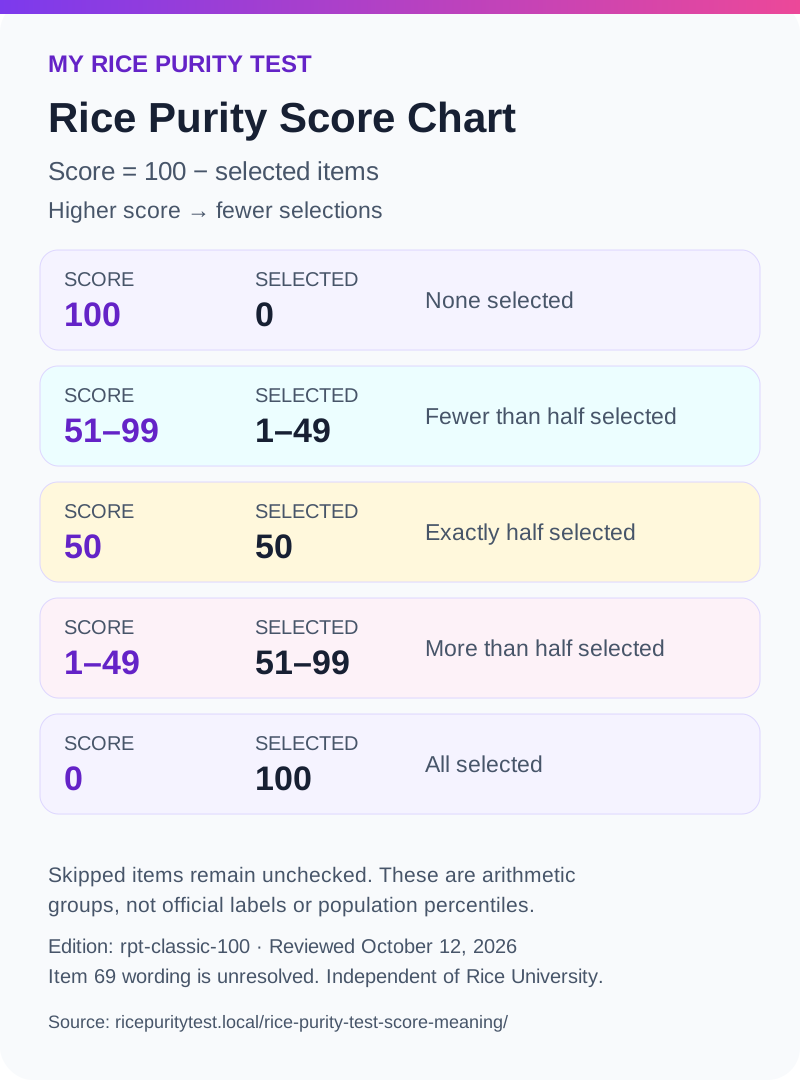
| Score | Selected items | What the count says |
|---|---|---|
| 100 | 0 | None selected |
| 51–99 | 1–49 | Fewer than half selected |
| 50 | 50 | Exactly half selected |
| 1–49 | 51–99 | More than half selected |
| 0 | 100 | All selected |

Different publishers may draw score bands at different boundaries or give them different names. Those categories are editorial groupings; this research has not verified a universally official classification. Our score range chart describes arithmetic, not morality or personality. Scores from 1 to 99 do not identify which questions were selected. The endpoints identify none or all selected, but still do not verify real experiences.
Print or Download the Score Chart
Choose a printable Rice Purity score chart for the exact numbers, or keep a compact visual guide to the scale. These references describe selections on this edition, not a ranking of people.

Print a Quick Reference
Print the full score table using US Letter or A4. The print layout removes your lookup input and result, opens the chart, and includes the formula and edition notes.
Choose Print or Save as PDF in your browser. Preview before printing.

Download the Chart
Keep a compact, original infographic or a complete text-based reference. Both are static files with no personal result or quiz answers.
The infographic summarizes arithmetic ranges. The PDF lists all 101 scores with selectable text. For the accessible HTML alternative, use the full score table. The PDF is not fully tagged for screen readers.
What Is the Average Rice Purity Score?
No representative US average has been established by the research used for this guide. We do not publish a national benchmark, percentile, or age- or gender-based average.
Why 50 Is the Midpoint, Not a Population Benchmark
The endpoints are 0 and 100, so their midpoint is 50. A population average is a different calculation: the sum of people’s scores divided by the number of people. The scale alone cannot supply those scores or establish what is typical.
A measured average could happen to equal 50, but that would require evidence. Calling 50 the midpoint is a mathematical statement; calling it the average participant’s score would be an unsupported claim here.
What Would Make an Average Meaningful?
A useful average would identify the questionnaire edition, collection period, sample size, recruitment method, and population being described. It would also explain incomplete attempts, skipped questions, and uncertainty.
A self-selected set of online comments can describe those respondents without representing the US. Comparisons also depend on whether people used the same checklist and scoring. This site does not collect quiz answers or completed scores to build a visitor benchmark.
Before relying on an average, look for a documented sample and method. A number without those details is not enough to establish a typical result.
Published figures describe particular campus respondents, website submissions, or editorial estimates. Those are different kinds of evidence. Check the questionnaire edition, collection dates, sample, and calculation method before treating a number as a benchmark.
What Published Average-Score Sources Actually Show
These source notes distinguish a reported finding from a population benchmark. A published number can be checked in its source without its underlying data being independently reproduced.
| Source | Reported finding and limits |
|---|---|
| Bowdoin Orient campus survey | Reported mean: 57 among participating score respondents. Survey conducted April 2026; published May 1, 2026. The overall survey received 376 responses, but the score-question denominator was not established in our review. The exact questionnaire edition and missing-response handling were not verified. This is a bounded campus report, not a national, all-college, or exact-age average. |
| Unresolved historical attribution | The claim of 61.46 from 124,952 results remains attributed and unresolved. Secondary publishers associate it with a historical Thresher report; the original statistical publication and methodology were not verified in our research. This secondary attribution is not primary verification. We do not call the figure official, national, or a 2026 average. |
| Website publisher statistics | Publisher-collected scores describe the site’s participating audience, subject to its collection method. Editorial estimates describe assumptions rather than a measured population. Recruitment, repeat attempts, collection dates, exclusions, and questionnaire version matter. Conflicting or unverifiable figures are not adopted here as established benchmarks. |
Is There a Reliable Average by Age?
This research did not establish reliable exact-age US averages for ages 12 through 20. The table records evidence availability, not scores someone should achieve.
| Ages requested | What was established |
|---|---|
| 12, 13, 14, 15, 16, 17 | No reliable exact-age US benchmark verified. Broad teenage bands cannot supply averages for individual ages. |
| 18 | Publisher estimates and broad college-age groups were found, but not a reliable exact-age US norm. |
| 19, 20 | Broader age bands and class-year reports do not establish separate averages for either exact age. |
Voluntary website samples describe people who chose to participate. A class year is not an age, and an age band cannot be interpolated into a single-year average. No reader needs to reach a particular score. We do not ask readers to submit ages, scores, or intimate answers.
What Can College Surveys Tell Us?
A campus survey can describe its participating respondents when its method and limitations are stated. The Bowdoin example above is a campus finding, not a result for all college students or the national population.
College-by-college comparisons would require comparable recruitment, collection periods, score-question response counts, and questionnaire editions. Different class-year groups are not exact-age samples. We do not turn these reports into college rankings or personal targets.
Mean, Median, and Percentile Are Different
Add the scores and divide by the number of scores. It describes the scores included in that calculation.
Order the scores and find the middle value. With an even number of scores, average the two middle values.
A score’s position in a defined comparison distribution, using a stated calculation method. A mean alone cannot establish it.
50 is the midpoint of a 0–100 scale. That arithmetic fact does not establish the average participant score.
Neither summary describes personal worth. Read the existing percentage-versus-percentile explanation and good-score interpretation for the limits of comparisons.
Is There a Verified Average for 2025 or 2026?
This research did not establish a representative US average for 2025 or 2026. An article’s publication or update date is not necessarily its survey collection date.
A website refreshed in 2026 does not prove it measured a representative 2026 population. Bowdoin’s spring 2026 report remains a campus-survey example with the limitations documented above. Historical statistics should retain their original context, not become current-year results because a page was updated.
What Your Score Cannot Tell You
The result counts selected items. It does not measure personality, morality, innocence, mental health, or personal worth.
Does the Score Measure Innocence?
No. The checklist’s traditional “purity” language does not make it a validated measure of innocence. Its name is a cultural framing, not a scientific assessment.
The list gives every item one point even though the experiences differ widely. A total cannot explain consent, context, seriousness, or how someone feels about an experience. Read our score and questionnaire limitations if you need more context.
Can You Infer Someone’s Answers From Their Score?
For scores from 1 to 99, you cannot uniquely identify the selected questions. Different answer sets can have the same count. A score of 77, for example, means 23 selections, but it does not name those 23 items.
The endpoints are exceptions to that selected-set rule: 100 means none selected and 0 means all 100 selected. Even then, the result does not verify someone’s actual life experiences, their interpretation of a question, or the circumstances behind an answer.

A count, not a profile. Do not infer specific experiences or a person’s identity from an interior score.

Your number stays here. This lookup calculates in browser memory. It does not save the input, send it to a server, or automatically share it.
Context matters. Skips, uncertainty, and edition differences can change what a comparison means.
Ordinary page requests are separate from the lookup. See how your information is handled for the site’s broader privacy practices.
Does the Questionnaire Version Matter?
Yes. The conversion in this guide applies to 100 equally weighted questions. The same number from a different checklist may not represent comparable selections.
Which Edition This Guide Explains
This guide explains the traditional 100-item web checklist supplied by the website owner and used on our homepage. It is not the separately drafted modern adaptation. Promotional item 0 is excluded; the questionnaire preserves the supplied order and wording.
For the exact items and separate editorial notes, browse the Questions Reference before comparing results from different editions.
Dataset ID: rpt-classic-100. Version: owner-supplied-2026-10-12-5133ffee2a3b. Source reference: the pinned traditional web edition, with the owner’s downloaded file used for the actual extraction. Editorial review: October 12, 2026.
The supplied edition represents item 69 literally as “?”. Its meaning remains unresolved. We retain that text with labeled help rather than invent a replacement. If you leave it unchecked, it deducts no point; if selected, it deducts one like every other item. That ambiguity is a limitation when interpreting or comparing results.
Historical questionnaires associated with Rice University and The Rice Thresher should not be assumed to be identical to this modern web checklist. My Rice Purity Test is independent of both. Owner authorization is recorded separately from third-party licensing evidence; it is not a claim of official endorsement or legal clearance.
Read which questionnaire version we use before comparing results across sites.
Is There an Official Score-Meaning Chart?
We have not verified an authoritative score-meaning standard for this edition. The chart here explains exact selected counts and mathematical groupings; it does not present editorial labels as official Rice University classifications.
If you find a source that would improve the edition context or a factual correction, suggest a correction. Please do not send private answers or someone else’s result.
Rice Purity Test Score Meaning FAQ
Does a Score of 92 Mean I Selected 92 Items?
No. A score of 92 means eight items were selected: 100 − 92 = 8. Your score and selected-item count add to 100.
Can Skipping a Question Change My Score?
An unchecked question deducts nothing. Selecting that same item would deduct one point, so skipping can change the result compared with selecting it. The total does not distinguish a skipped question from an answer left unchecked for another reason.
Why Can My Score Change When I Retake the Test?
The tool recalculates from the selections in the current attempt. New experiences, different recollections or interpretations, skips, and a different questionnaire edition can all change a result. A previous score is not a permanent record, and retaking need not produce a lower number.
Can I Average Scores From My Friends?
Yes, you can calculate an arithmetic mean for that particular group if everyone used the same edition and scoring. Add the scores and divide by the number of participants. That group average is not automatically representative of anyone else. Only include scores people freely choose to share.
Should I Use TikTok Score Labels?
Treat creator labels as that creator’s interpretation. TikTok labels are not part of this site’s scoring model and are not verified benchmarks here. A label cannot establish someone’s character or specific experiences from a total.
Are Reddit Score Averages Reliable?
A self-selected Reddit discussion does not establish a representative US average. Check who responded, how they were recruited, which edition they used, and how incomplete attempts were handled. Anecdotes can be interesting without being a population benchmark.
Do I Have to Share My Score?
No. You can keep it private. This lookup does not automatically share or store your score, and it does not require your quiz answers. Avoid posting screenshots that reveal selections or sharing someone else’s result without permission. Our Privacy Policy explains the wider site practices.
Is my Rice Purity score a percentage or percentile?
It is a score out of 100. Because this edition has 100 equally weighted items, a score of 73 also corresponds to 73% unchecked and 27% selected items. It is not a population percentile, and it does not measure a percentage of innocence. Skips are included among unchecked items.
Can I print the score chart without printing my result?
Yes. Print Score Chart uses a reference-only layout that excludes your input and personal result. The downloadable infographic and PDF are also static and contain no visitor answers or result. Check the browser preview before saving or printing, especially on a shared device.
What Is a Good Score on the Rice Purity Test?
No universal good-score threshold is established for this edition. The result counts selected items; it does not rank people. See the good-score explanation for examples and the limits of comparisons.
Is There a Verified Average Rice Purity Test Score in the US?
No representative US average was verified in this research. Campus respondents and voluntary website participants do not automatically represent everyone in the country. Read the source-evidence notes before using a number as a benchmark.
Is There a Reliable Average for My Exact Age?
No reliable exact-age US benchmarks were verified in this review. Broad age bands and college class years cannot establish an average for an individual age. See the age-evidence assessment; there is no score you need to achieve.
Can a College Survey Tell Me What I Should Score?
No. A campus survey describes its participating respondents, subject to its methodology, not a personal target. The college-survey explanation sets out those limits.
Your score is a count, not a verdict. Use the lookup when you need the arithmetic, and keep the edition and skipped answers in mind when comparing totals. If you want a new result, take the checklist at your own pace.
Take or Retake the Rice Purity Test
About the Author
My Rice Purity Test Editorial TeamThe My Rice Purity Test Editorial Team creates and maintains guides about Rice Purity Test questions, scores, history, and related topics. We aim to make our content clear, useful, and supported by reliable sources where appropriate.
Meet Our Editorial Team